Is Inventory Getting Back To Normal?
Is Inventory Getting Back To Normal?

After years of feeling like finding the right home was nearly impossible, the situation is starting to improve.
Across the country, housing inventory is on the rise, which means you now have more options when it comes to making a move. But it’s important to understand that the extent of that increase depends on where you live. That’s why working with a local agent who understands your market is so valuable.
Here’s a quick summary of the current inventory landscape to give you a clearer picture.
Significant Growth Across the Nation
The number of homes for sale is increasing nationwide – and that trend holds true in every region. Data from Realtor.com shows that inventory is up at least 19% year-over-year in all four regions. In the West, it’s jumped by nearly 41% since the same time last year (see graph below):
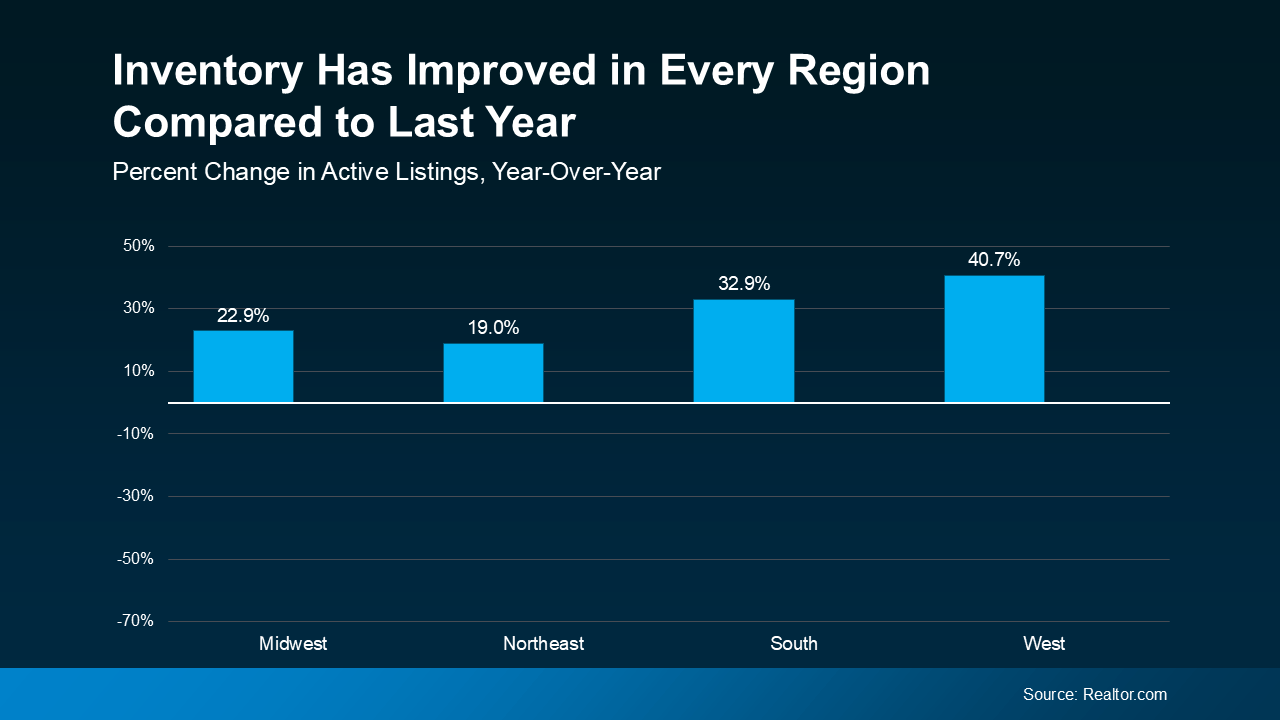
There are two key factors driving this increase:
-
More homeowners are putting their properties on the market. Many had been holding off, waiting for mortgage rates to come down. But now, some are choosing to move forward regardless. In fact, May saw the highest number of new listings for that month in the past three years.
-
Homes are also spending more time on the market. With properties taking longer to sell, the total inventory is increasing. In May, the average time on the market was 51 days, which is more in line with typical market conditions.
An increase in available homes contributes to a more balanced housing market. Over the last few years, sellers had the advantage, but the landscape is beginning to shift. While it’s not yet a full buyer’s market nationally, the environment is gradually becoming more favorable for buyers. As Danielle Hale, Chief Economist at Realtor.com, notes:
“The number of homes for sale is rising in many markets, giving shoppers more choices than they’ve had in years . . . the market is starting to rebalance.”
How Much Growth We’ve Seen Varies by Area
The timeline for reaching full balance will differ depending on the location. Some areas are seeing inventory return to more typical levels, while others are still catching up.
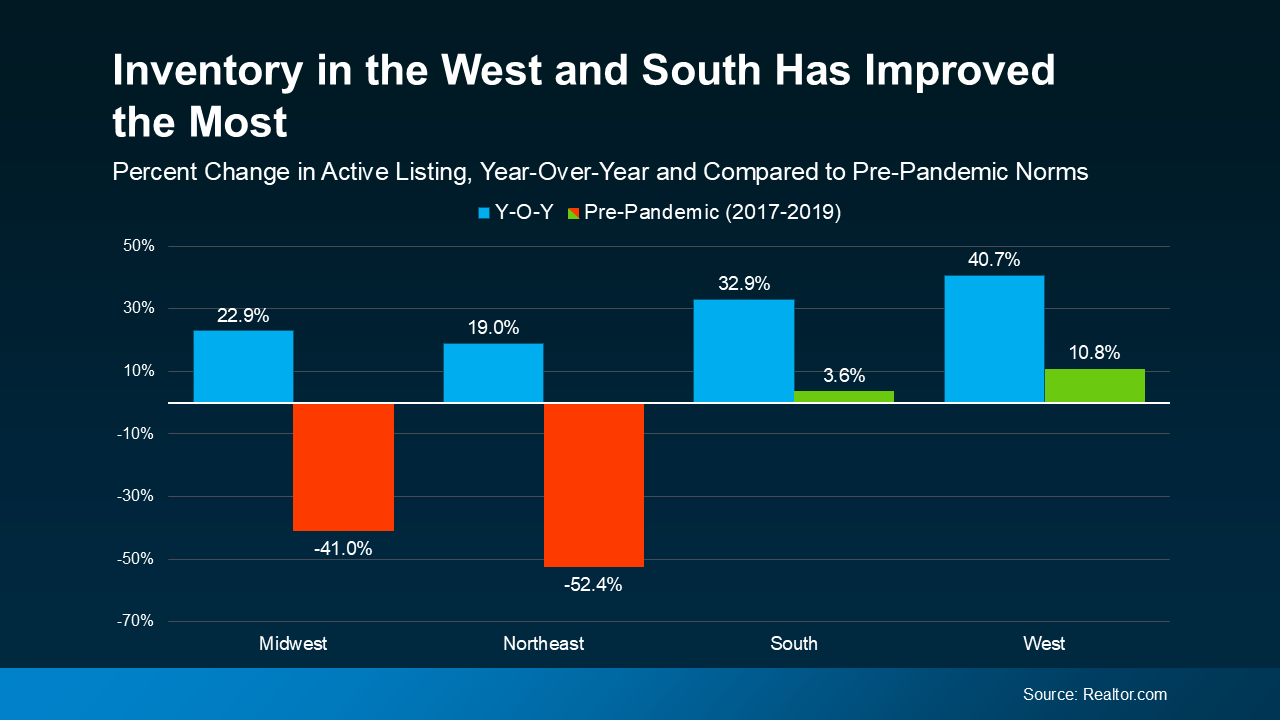
Take a look at the next graph. It compares current data with the housing inventory during the last normal period (2017–2019).
Green highlights areas that are closer to typical inventory levels. Red indicates markets where progress has been made, but inventory still falls short of those earlier norms (see graph below):
You now have more options available compared to a year ago, making it easier to find a home that suits your needs.
However, inventory recovery differs by market. That’s why it’s important to work with a local agent who understands your area. They can provide insights into local inventory growth and guide your search accordingly. This is just one reason why having a local expert matters.
Bottom Line
Housing supply is improving, but the pace of recovery depends on your location. Let’s discuss the current state of our local market and what that means for your next steps.
What changes have you noticed in the market compared to a year or two ago?
Categories
Recent Posts